

car-py.md 11 KB
- 数据集最新版本地址获取:http://www.fueleconomy.gov/feg/epadata/vehicles.csv.zip。
各个变量的信息:http://www.fueleconomy.gov/feg/ws/index.shtml#vehicle。
import pandas as pd
import numpy as np
import ggplot as gp
# from ggplot import *
import matplotlib.pyplot as plt
import os
/usr/local/lib/python2.7/dist-packages/ggplot/utils.py:81: FutureWarning: pandas.tslib is deprecated and will be removed in a future version. You can access Timestamp as pandas.Timestamp pd.tslib.Timestamp, /usr/local/lib/python2.7/dist-packages/ggplot/stats/smoothers.py:4: FutureWarning: The pandas.lib module is deprecated and will be removed in a future version. These are private functions and can be accessed from pandas._libs.lib instead from pandas.lib import Timestamp /usr/local/lib/python2.7/dist-packages/statsmodels/compat/pandas.py:56: FutureWarning: The pandas.core.datetools module is deprecated and will be removed in a future version. Please use the pandas.tseries module instead. from pandas.core import datetools
print(os.getcwd())
os.chdir("/media/sf_share/linux/car")
/media/sf_share/linux/car
# [39270 rows x 83 columns]
vehicles = pd.read_csv("input/vehicles.csv")
# print(vehicles.head)
print(len(vehicles))
print(len(vehicles.columns))
print(vehicles.columns)
39270 83 Index([u'barrels08', u'barrelsA08', u'charge120', u'charge240', u'city08',
   u'city08U', u'cityA08', u'cityA08U', u'cityCD', u'cityE', u'cityUF',
   u'co2', u'co2A', u'co2TailpipeAGpm', u'co2TailpipeGpm', u'comb08',
   u'comb08U', u'combA08', u'combA08U', u'combE', u'combinedCD',
   u'combinedUF', u'cylinders', u'displ', u'drive', u'engId', u'eng_dscr',
   u'feScore', u'fuelCost08', u'fuelCostA08', u'fuelType', u'fuelType1',
   u'ghgScore', u'ghgScoreA', u'highway08', u'highway08U', u'highwayA08',
   u'highwayA08U', u'highwayCD', u'highwayE', u'highwayUF', u'hlv', u'hpv',
   u'id', u'lv2', u'lv4', u'make', u'model', u'mpgData', u'phevBlended',
   u'pv2', u'pv4', u'range', u'rangeCity', u'rangeCityA', u'rangeHwy',
   u'rangeHwyA', u'trany', u'UCity', u'UCityA', u'UHighway', u'UHighwayA',
   u'VClass', u'year', u'youSaveSpend', u'guzzler', u'trans_dscr',
   u'tCharger', u'sCharger', u'atvType', u'fuelType2', u'rangeA',
   u'evMotor', u'mfrCode', u'c240Dscr', u'charge240b', u'c240bDscr',
   u'createdOn', u'modifiedOn', u'startStop', u'phevCity', u'phevHwy',
   u'phevComb'],
  dtype='object')
/usr/local/lib/python2.7/dist-packages/IPython/core/interactiveshell.py:2717: DtypeWarning: Columns (70,71,72,73,74,76,79) have mixed types. Specify dtype option on import or set low_memory=False. interactivity=interactivity, compiler=compiler, result=result)
# 查看年份信息,数据总共覆盖35年,从1984年到2018年。

print(len(pd.unique(vehicles.year)))
print(min(vehicles.year))
print(max(vehicles.year))
35 1984 2018
# 查看燃料类型
pd.value_counts(vehicles.fuelType)
Regular 25698 Premium 10671 Gasoline or E85 1269 Diesel 1103 Electricity 145 Premium or E85 125 Midgrade 90 CNG 60 Premium and Electricity 37 Regular Gas and Electricity 22 Gasoline or natural gas 20 Premium Gas or Electricity 19 Gasoline or propane 8 Regular Gas or Electricity 3 Name: fuelType, dtype: int64
trany变量分析
# 查看变速箱类型,首字母A和M开头
pd.value_counts(vehicles.trany)
Automatic 4-spd                     11045
Manual 5-spd                         8339
Automatic 3-spd                      3151
Automatic (S6)                       2879
Manual 6-spd                         2584
Automatic 5-spd                      2198
Automatic 6-spd                      1526
Manual 4-spd                         1483
Automatic (S8)                       1211
Automatic (S5)                        830
Automatic (variable gear ratios)      744
Automatic 7-spd                       695
Automatic (AM-S7)                     334
Automatic 8-spd                       326
Automatic (S7)                        294
Automatic (S4)                        233
Automatic (AM7)                       196
Automatic (AV-S6)                     174
Automatic 9-spd                       170
Automatic (A1)                        137
Automatic (AM6)                       128
Automatic (AM-S6)                     111
Automatic (AV-S7)                     101
Manual 7-spd                           93
Manual 3-spd                           77
Automatic (S9)                         48
Automatic (S10)                        42
Automatic (AV-S8)                      32
Automatic (AM-S8)                      28
Manual 4-spd Doubled                   17
Automatic (AM5)                        14
Automatic 10-spd                        8
Automatic (AM8)                         5
Automatic (L4)                          2
Automatic (L3)                          2
Automatic (AV-S10)                      1
Automatic (AM-S9)                       1
Name: trany, dtype: int64
# trany变量自动挡是以A开头,手动挡是以M开头;故创建一个新变量trany2:
# 取首字母
vehicles['trany2'] = vehicles.trany.str[0]
pd.value_counts(vehicles.trany2)
# 可以看到,自动挡26666,手动挡12593
A    26666
M    12593
Name: trany2, dtype: int64
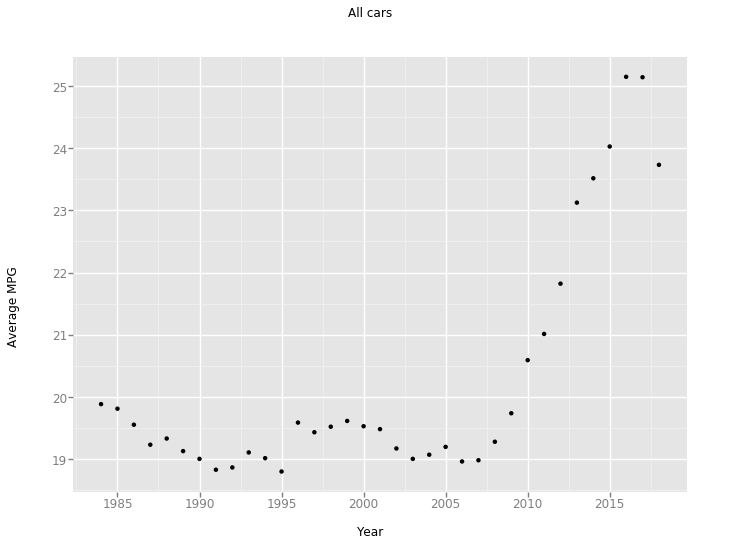
# 先按照年份分组
grouped = vehicles.groupby('year')

# 再计算其中三列的均值
averaged= grouped['comb08', 'highway08', 'city08'].agg([np.mean])

# 为方便分析,对其进行重命名,然后创建一个‘year’的列,包含该数据框data frame的索引
averaged.columns = ['comb08_mean', 'highwayo8_mean', 'city08_mean']
averaged['year'] = averaged.index

# 使用ggplot包将结果绘成散点图
gp1=gp.ggplot(averaged, gp.aes('year', 'comb08_mean')) + gp.geom_point(colour='steelblue') + gp.xlab("Year") + gp.ylab("Average MPG") + gp.ggtitle("All cars")
print(gp1)
<ggplot: (8771518469409)>
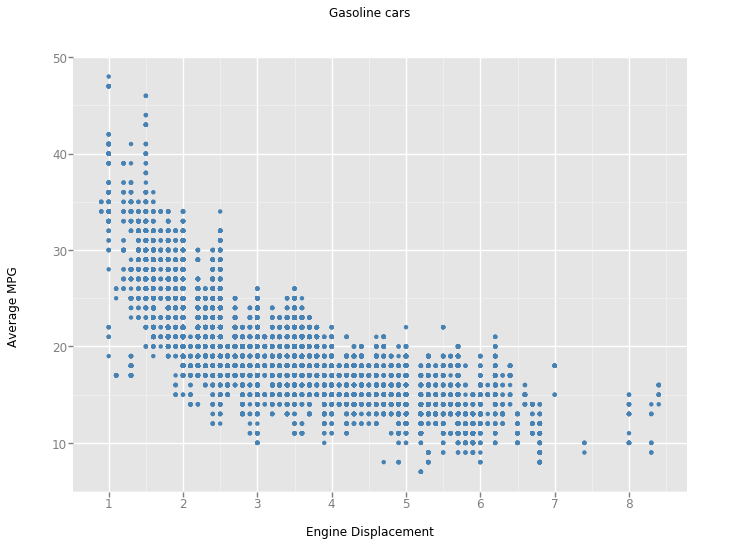
# 去除混合动力汽车
criteria1 = vehicles.fuelType1.isin(['Regular Gasoline', 'Premium Gasoline', 'Midgrade Gasoline'])
criteria2 = vehicles.fuelType2.isnull()
criteria3 = vehicles.atvType != 'Hybrid'
vehicles_non_hybrid = vehicles[criteria1 & criteria2 & criteria3]
# 将得到的数据框data frame按年份分组,并计算平均油耗
grouped = vehicles_non_hybrid.groupby(['year'])
averaged = grouped['comb08'].agg([np.mean])
averaged['hahhahah']  = averaged.index
#  查看是否大引擎的汽车越来越少
pd.unique(vehicles_non_hybrid.displ)
array([ 2. ,  4.9,  2.2,  5.2,  1.8,  1.6,  2.3,  2.8,  4. ,  5. ,  3.3,
        3.1,  3.8,  4.6,  3.4,  3. ,  5.9,  2.5,  4.5,  6.8,  2.4,  2.9,
        5.7,  4.3,  3.5,  5.8,  3.2,  4.2,  1.9,  2.6,  7.4,  3.9,  1.5,
        1.3,  4.1,  8. ,  6. ,  3.6,  5.4,  5.6,  1. ,  2.1,  1.2,  6.5,
        2.7,  4.7,  5.5,  1.1,  5.3,  4.4,  3.7,  6.7,  4.8,  1.7,  6.2,
        8.3,  1.4,  6.1,  7. ,  8.4,  6.3,  nan,  6.6,  6.4,  0.9])
# 去掉nan值,并用astype方法保证各个值都是float型的
criteria = vehicles_non_hybrid.displ.notnull()
vehicles_non_hybrid = vehicles_non_hybrid[criteria]
vehicles_non_hybrid.loc[:,'displ'] = vehicles_non_hybrid.displ.astype('float')
criteria = vehicles_non_hybrid.comb08.notnull()
vehicles_non_hybrid = vehicles_non_hybrid[criteria]
vehicles_non_hybrid.loc[:,'comb08'] = vehicles_non_hybrid.comb08.astype('float')
/usr/local/lib/python2.7/dist-packages/pandas/core/indexing.py:517: SettingWithCopyWarning:
A value is trying to be set on a copy of a slice from a DataFrame.
Try using .loc[row_indexer,col_indexer] = value instead

See the caveats in the documentation: http://pandas.pydata.org/pandas-docs/stable/indexing.html#indexing-view-versus-copy
  self.obj[item] = s
# 最后用ggplot包来绘图
gp2=gp.ggplot(vehicles_non_hybrid, gp.aes('displ', 'comb08')) + gp.geom_point(color='steelblue') + \
gp.xlab('Engine Displacement') + gp.ylab('Average MPG') + gp.ggtitle('Gasoline cars')
print(gp2)
<ggplot: (8771518485969)>
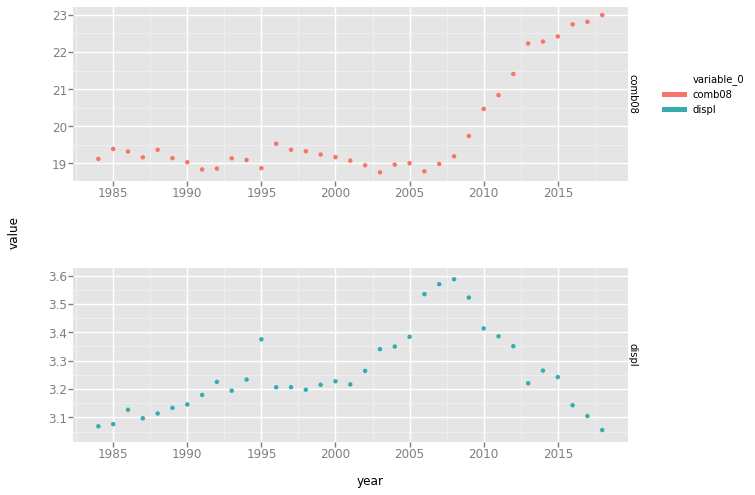
# 查看是否平均起来汽车越来越少了
grouped_by_year = vehicles_non_hybrid.groupby(['year'])
avg_grouped_by_year = grouped_by_year['displ', 'comb08'].agg([np.mean])
# -  计算displ和conm08的均值,并改造数据框data frame
avg_grouped_by_year['year'] = avg_grouped_by_year.index
melted_avg_grouped_by_year = pd.melt(avg_grouped_by_year, id_vars='year')
# -  创建分屏绘图
p = gp.ggplot(gp.aes(x='year', y='value', color = 'variable_0'), data=melted_avg_grouped_by_year)
p + gp.geom_point() + gp.facet_grid("variable_0",scales="free") #scales参数fixed表示固定坐标轴刻度,free表示反馈坐标轴刻度
<ggplot: (8771517963333)>
pd.unique(vehicles_non_hybrid.cylinders)
array([ 4., 12., 8., 6., 5., 10., 2., 3., 16., nan])
vehicles_non_hybrid.cylinders = vehicles_non_hybrid.cylinders.astype('float')
pd.unique(vehicles_non_hybrid.cylinders)
array([ 4., 12., 8., 6., 5., 10., 2., 3., 16., nan])
vehicles_non_hybrid_4 = vehicles_non_hybrid[(vehicles_non_hybrid.cylinders==4.0)]
grouped_by_year_4_cylinder = vehicles_non_hybrid_4.groupby(['year']).make.nunique()
fig = grouped_by_year_4_cylinder.plot()
fig.set_xlabel('Year')
fig.set_ylabel('Number of 4-Cylinder Maker')
<matplotlib.text.Text at 0x7fa4733c98d0>
grouped_by_year_4_cylinder = vehicles_non_hybrid_4.groupby(['year'])
unique_makes = []
for name, group in grouped_by_year_4_cylinder:
    unique_makes.append(set(pd.unique(group['make'])))

unique_makes = reduce(set.intersection, unique_makes)
print(unique_makes)
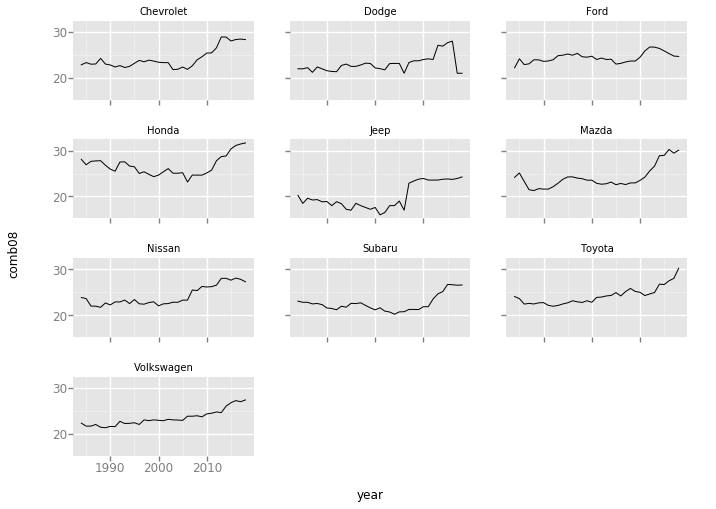
set(['Dodge', 'Jeep', 'Chevrolet', 'Nissan', 'Honda', 'Toyota', 'Volkswagen', 'Mazda', 'Subaru', 'Ford'])
# 最终选取在unique_makes集合中存在的品牌
boolean_mask = []
for index, row in vehicles_non_hybrid_4.iterrows():
    make = row['make']
    boolean_mask.append(make in unique_makes)
df_common_makes = vehicles_non_hybrid_4[boolean_mask]
# 先将数据框data frame按year和make分组,然后计算各组的均值
df_common_makes_grouped = df_common_makes.groupby(['year', 'make']).agg(np.mean).reset_index()
# 最后利用ggplot提供的分屏图来显示结果
gp.ggplot(gp.aes(x='year', y='comb08'), data = df_common_makes_grouped) \
+ gp.geom_line() + gp.facet_wrap('make')
<ggplot: (8771516938941)>